|
Greenspan. The Clintonites also extended the Pollyanna Creep of the nation's employment figures. Although expunged from the ranks of the unemployed discouraged workers had nevertheless been counted in the larger workforce.
But in 1994, the Bureau of Labor Statistics redefined the workforce to include only that small percentage of the discouraged who had been seeking work for less than a year. The longer-term discouraged—some 4 million U.S. adults—fell out of the main monthly tally. Some now call them
the "hidden unemployed." For its last four years, the Clinton Administration also thinned the monthly household economic sampling by one sixth, from 60,000 to 50,000, and a disproportionate number of the dropped households were in the
inner cities; the reduced sample (and a new adjustment formula) is believed to have reduced black unemployment estimates and eased worsening
poverty figures.
Despite the present Bush Administration's overall penchant for manipulating
data (e.g., Iraq, climate change), it has yet to match its predecessor in economic
revisions. In 2002, the administration did, however, for two months fail to publish the Mass Layoff Statistics report, because of
its embarrassing nature after the 2001 recession had supposedly ended; it introduced,
that same year, an "experimental" new CPI calculation (the
C-CP1-U), which shaved another 0.3 percent off the official CPl; and since 2006 it has stopped publishing the M-3 money supply numbers, which captured
rising inflationary impetus from bank credit activity. In 2005, Bush proposed, but Congress shunned, a new, narrower
historical wage basis for calculating future retiree Social Security benefits.
By
late last year, the Gallup Poll reported that public faith in the federal government had sunk below even post-Watergate levels. Whether statistical deceit played
any direct role is unclear, but it does seem that citizens have got the right general
idea. After forty years of manipulation, more than a few measurements of the
U.S. economy have been distorted beyond recognition.
AMERICA’S
“OPACITY” CRISIS
Last year, the word "opacity," hitherto reserved for Scrabble games, became
a mainstay of the financial press. A credit market panic had been triggered by something called collateralized debt obligations (CDOs), which in some cases were too complicated to be fathomed even by experts. The
packagers and marketers of CDOs were forced to acknowledge that their hyper-technical
securities were fraught with "opacity"—a convenient, ethically and
legally judgment-free word for lack of honest labeling. And far from being rare,
opacity is commonplace in contemporary finance. Intricacy has become a conduit for deception Exotic derivative instruments
with alphabet-soup initials command notional values in the hundreds of trillions
of dollars, but nobody knows what they are really worth. Some days, half of the
trades on major stock exchanges come from so-called black boxes programmed with everything from binomial trees to algorithms;
most federal securities regulators couldn't explain them, much less monitor
them.
Transparency is the hallmark of democracy, but we now find ourselves with economic statistics every bit as opaque—and as vulnerable to double-dealing—as a subprime CDO. Of the "big three" statistics, let us start with unemployment.
Most of the people tired of looking for work, as mentioned above, are no longer counted in the workforce, though they do still show up
in one of the auxiliary unemployment numbers. The BLS has six different regular jobless measurements—U-l, U-2, U-3 (the one routinely
cited), U-4, U-5, and U-6. In January 2008, the U-4 to U-6 series produced unemployment numbers
ranging from 5.2 percent to 9.0 percent, all above the "official" number. The series nearest to real-world conditions is, not surprisingly, die highest: U-6, which includes part-timers looking for full-time employment
as well as other members of the "marginally attached," a new catchall meaning
those not looking for a job but who say they want one. Yet this does not even include the Americans who (as Austan Goolsbee puts
it) have been "bought off the unemployment rolls" by government programs such as Social Security disability, whose recipients are classified as outside the labor force.
Second is the Gross Domestic Product, which in itself represents something of a fudge: federal economists
used the Gross National Product until 1991, when rising U.S. international debt costs made the narrower GDP assessment more palatable. The GDP has been subject to many further fiddles, the most manipulatable
of which are the adjustments made for the presumed starting up and ending of businesses (the "birth/death of businesses"
equation) and the amounts that the Bureau
of Economic Analysis "imputes" to nationwide personal income data
(known as phantom income boosters, or imputations; for example, the imputed income from living in one's own home, or the benefit one receives from a free checking account,
or the value of employer-paid health- and life-insurance premiums). During 2007, believe it or not, imputed income accounted for some 15 percent of GDP.
John Williams, the economic statistician, is briskly contemptuous of GDP numbers over the past quarter century. "Upward growth biases built into
GDP modeling since the early 1980s have rendered this important series nearly worthless," he wrote in
2004. "{The recessions of 1990/1991 and 2001 were
much longer and deeper than currently reported (and] lesser downturns in 1986 and 1995 were missed completely."
Nothing, however, can match the tortured evolution of the third key
number, the somewhat misnamed Consumer Price Index. Government economists themselves
admit that the revisions during the Clinton years worked to reduce the current inflation figures by more than a percentage point, but the
overall distortion has been considerably more severe. Just the 1983 manipulation, which substituted "owner equivalent rent" for home-ownership costs,
served to understate or reduce inflation during the recent housing boom by 3 to 4 percentage points. [5] Moreover, since the 1990s,
the CPI has been
subjected to three other adjustments, all downward and all dubious: product substitution (if flank steak gets too expensive, people are
assumed to shift to hamburger, but nobody is assumed to move up to filet mignon), geometric weighting (goods and services in which costs are
rising most rapidly get a lower weighting for a presumed reduction in consumption), and, most bizarrely, hedonic adjustment,
an unusual computation by which additional
quality is attributed to a product or service.
The hedonic adjustment, in particular, is as hard to estimate as it
is to take seriously. {That it was launched during the tenure of the Oval Office's preeminent hedonist, William Jefferson Clinton, only adds to
die absurdity.) No small part of the condemnation must lie in the timing. If quality improvements are to be counted, that count should have begun
in the 1950s and 1960s, when such products and services as air-conditioning, air travel, and automatic transmissions—and these
are just the A's!—improved consumer satisfaction to a comparable or greater degree
than have more recent innovations. That die change was made only in the late Nineties
shrieks of politics and opportunism, not integrity of measurement. Most of the time, hedonic adjustment is used to reduce
the effective cost of goods, which in turn reduces die stated rate of inflation. Reversing the theory, however, the declining
quality of goods or services should adjust effective prices and thereby add to
inflation, but that side of the equation generally goes missing. "AH in all,"
Williams points out, "if you were to peel back changes that were made in the CPI going
back to the Carter years, you'd see that the CPI would now be 3.5 percent to 4 percent higher"—meaning that,
because of lost CPI increases, Social Security checks would be 70 percent greater than they currently are.
Furthermore, when discussing price pressure, government officials invariably bring up "core" inflation, which excludes precisely the two categories-—food
and energy—now verging on another 1970s-style price surge. This year
we have already seen major U.S. food and grocery companies, among them Kellogg and Kraft, report sharp declines in earnings caused
by rising grain and dairy prices. Central banks from Europe to Japan worry that the biggest inflation
jumps in ten to fifteen years could get in the way of reducing interest rates to cope
with weakening economies. Even the U.S. Labor Department acknowledged that in January, the price of imported goods had increased 13.7 percent compared with a year earlier,
the biggest surge since record-keeping began in 1982. From Maine to Australia,
from Alaska to the Middle East, a hydra-headed inflation is on the loose, unleashed
by the many years of rapid growth in the supply of money from the world's central banks
(not least the U.S. Federal Reserve), as well as by massive public and private
debt creation.
THE U.S. ECONOMY EX-DISTORTION
The real numbers, to most economically minded Americans, would be a face full of cold water. Based on the criteria in place a quarter century ago, today's U.S. unemployment
rate is somewhere between 9 percent and 12 percent; the inflation rate is as high as 7 or even 10 percent; economic growth since the recession
of 2001 has been mediocre, despite a huge surge in the wealth and incomes of the superrich, and we are falling back into recession. If what
we have been sold in recent years has been delusional "Pollyanna Creep," what we really need today is a picture of our economy ex-distortion.
For what it would reveal is a nation in deep difficulty not just domestically but globally.
Under-measurement of inflation, in particular, hangs over our heads like a guillotine.
To acknowledge it would send interest rates climbing, and thereby would endanger the viability of die massive buildup of public and
private debt (from less than $11 trillion in 1987 to $49 trillion last year) that props
up the American economy. Moreover, the rising cost of pensions, benefits,
borrowing, and interest payments—all indexed or related to inflation—could join with the cost of financial
bailouts to overwhelm the federal budget As inflation and interest rates have
been kept artificially suppressed, the United States has been indentured
to its volatile financial sector, with its predilection for leverage and risky buccaneering.
Arguably,
the unraveling has already begun. As Robert Hardaway, a professor at the University of Denver, pointed out last September, the sub* prime
lending crisis "can be directly traced back to die [1983] BLS decision to exclude the price of housing from the CPI.... With the illusion of low inflation inducing lenders to offer 6 percent
loans, not only has speculation run rampant on the expectations of ever-rising home
prices, but home buyers by the millions have been tricked into buying homes even though they only qualified for the teaser rates." Were mainstream
interest rates to jump into the 7 to 9 percent range—which could happen if inflation were to spur new concern—both Washington and Wall Street would
be walking in quicksand. The make-believe economy of the past two decades, with its asset bubbles, massive borrowing,
and rampant data distortion, would be in serious jeopardy. The U.S. dollar, off
more than 40 percent against the euro since 2002, could slip down an even rockier
slope.
The
credit markets are fearful, and die financial markets are nervous. If gloom continues,
our humbugged nation may truly regret losing sight of history, risk, and common sense.
| Blue is real, arrived by using correct CPI figures |
|
| 1985-08 Blue is actual unemployment rate |
|
Consumer Price Index October 1st, 2004
"GOVERNMENT
ECONOMIC REPORTS: THINGS YOU'VE SUSPECTED BUT WERE AFRAID TO ASK!"
A Series Authored by Walter J. "John" Williams
"The Consumer Price Index" (Part Four in a Series of Five)
October
1, 2006 Update
(September
22, 2004 Original)
_____
http://www.shadowstats.com/article/56, John Williams site, Shadow Government Statistics:
Analysis Behind and Beyond Government Economic Reporting.
Foreword
This installment has been updated from the original 2004 version to incorporate
additional research on earlier changes to the CPI. The source for most of the information
in this installment is the Bureau of Labor Statistics, which generally has been very open about its methodologies and changes
to same. The BLS Web site: www.bls.gov contains descriptions of the CPI
and its related methodologies. Other sources include my own analyses of the CPI data and
methodological changes over the last 30 years as well as interviews with individuals involved in inflation reporting.
______
Payments to Social Security Recipients
Should be Double Current Levels
Inflation, as reported by the Consumer Price Index (CPI)
is understated by roughly 7% per year. This is due to recent redefinitions of the series as
well as to flawed methodologies, particularly adjustments to price measures for quality changes. The concentration of this
installment on the quality of government economic reports will be first on CPI series redefinition
and the damages done to those dependent on accurate cost-of-living estimates, and on pending further redefinition and economic
damage.
The CPI was designed to help businesses, individuals and the government
adjust their financial planning and considerations for the impact of inflation. The CPI
worked reasonably well for those purposes into the early-1980s. In recent decades, however, the reporting system increasingly
succumbed to pressures from miscreant politicians, who were and are intent upon stealing income from social security recipients,
without ever taking the issue of reduced entitlement payments before the public or Congress for approval.
In particular,
changes made in CPI methodology during the Clinton Administration understated inflation
significantly, and, through a cumulative effect with earlier changes that began in the late-Carter and early Reagan Administrations
have reduced current social security payments by roughly half from where they would have been otherwise. That means Social
Security checks today would be about double had the various changes not been made. In like manner, anyone involved in commerce,
who relies on receiving payments adjusted for the CPI, has been similarly damaged. On the
other side, if you are making payments based on the CPI (i.e., the federal government),
you are making out like a bandit.
In the original version of this background article, I noted that Social Security
payments should 43% higher, but that was back in September 2004 and only adjusted for CPI
changes that took place after 1993. The current estimate adjusts for methodology gimmicks introduced since 1980.
Elements
of the Consumer Price Index (CPI) had their roots in the mid-1880s, when the Bureau of
Labor, later known as the Bureau of Labor Statistics (BLS), was asked by Congress to measure
the impact of new tariffs on prices. It was another three decades, however, before price indices would be combined into something
resembling today's CPI, a measure used then for setting wage increases for World War I
shipbuilders. Although published regularly since 1921, the CPI did not come into broad
acceptance and use until after World War II, when it was included in auto union contracts as a cost-of-living adjustment for
wages.
The CPI found its way not only into other union agreements, but also into
most commercial contracts that required consideration of cost/price changes or inflation. The CPI
also was used to adjust Social Security payments annually for changes in the cost of living, and therein lay the eventual
downfall to the credibility of CPI reporting.
Let Them Eat Hamburger
In
the early 1990s, press reports began surfacing as to how the CPI really was significantly
overstating inflation. If only the CPI inflation rate could be reduced, it was argued,
then entitlements, such as social security, would not increase as much each year, and that would help to bring the budget
deficit under control. Behind this movement were financial luminaries Michael Boskin, then chief economist to the first Bush
Administration, and Alan Greenspan, Chairman of the Board of Governors of the Federal Reserve System.
Although the
ensuing political furor killed consideration of Congressionally mandated changes in the CPI,
the BLS quietly stepped forward and began changing the system, anyway, early in the Clinton
Administration.
Up until the Boskin/Greenspan agendum surfaced, the CPI was measured
using the costs of a fixed basket of goods, a fairly simple and straightforward concept. The identical basket of goods would
be priced at prevailing market costs for each period, and the period-to-period change in the cost of that market basket represented
the rate of inflation in terms of maintaining a constant standard of living.
The Boskin/Greenspan argument was that
when steak got too expensive, the consumer would substitute hamburger for the steak, and that the inflation measure should
reflect the costs tied to buying hamburger versus steak, instead of steak versus steak. Of course, replacing hamburger for
steak in the calculations would reduce the inflation rate, but it represented the rate of inflation in terms of maintaining
a declining standard of living. Cost of living was being replaced by the cost of survival. The old system told you how much
you had to increase your income in order to keep buying steak. The new system promised you hamburger, and then dog food, perhaps,
after that.
The Boskin/Greenspan concept violated the intent and common usage of the inflation index. The CPI
was considered sacrosanct within the Department of Labor, given the number of contractual relationships that were anchored
to it. The CPI was one number that never was to be revised, given its widespread usage.
Shortly after Clinton took control of the White House, however, attitudes
changed. The BLS initially did not institute a new CPI
measurement using a variable-basket of goods that allowed substitution of hamburger for steak, but rather tried to approximate
the effect by changing the weighting of goods in the CPI fixed basket. Over a period of
several years, straight arithmetic weighting of the CPI components was shifted to a geometric
weighting. The Boskin/Greenspan benefit of a geometric weighting was that it automatically gave a lower weighting to CPI
components that were rising in price, and a higher weighting to those items dropping in price.
Once the system had
been shifted fully to geometric weighting, the net effect was to reduce reported CPI on
an annual, or year-over-year basis, by 2.7% from what it would have been based on the traditional weighting methodology. The
results have been dramatic. The compounding effect since the early-1990s has reduced annual cost of living adjustments in
social security by more than a third.
The BLS publishes estimates of the effects
of major methodological changes over time on the reported inflation rate (see the "Reporting Focus" section of the October
2005 Shadow Government Statistics newsletter -- available to the public in the Archives of www.shadowstats.com). Changes estimated
by the BLS show roughly a 4% understatement in current annual CPI
inflation versus what would have been reported using the original methodology. Adding the roughly 3% lost to geometric weighting
-- most of which not included in the BLS estimates -- takes the current total CPI
understatement to roughly 7%.
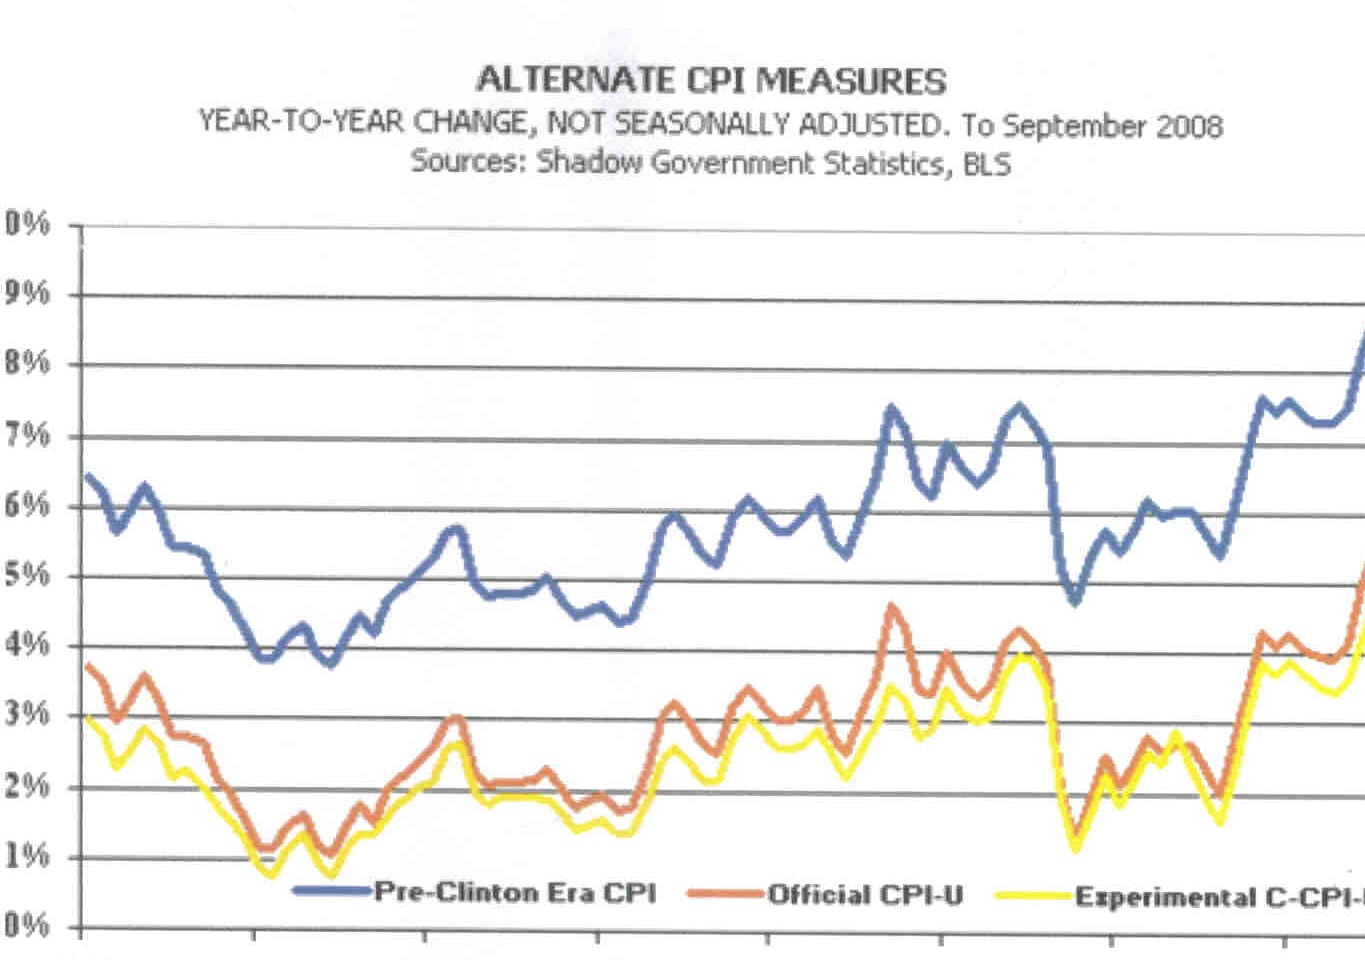
There now are three major CPI measures published
by the BLS, CPI for All Urban Consumers (CPI-U),
CPI for Urban Wage Earners and Clerical Workers (CPI-W)
and the Chained CPI-U (C-CPI-U). The CPI-U
is the popularly followed inflation measure reported in the financial media. It was introduced in 1978 as a more-broadly-based
version of the then existing CPI, which was renamed CPI-W.
The CPI-W is used in calculating Social Security benefits. These two series tend to move
together and are based on frequent price sampling, which is supposed to yield something close to an average monthly price
measure by component.
The C-CPI-U was introduced during the second Bush Administration
as an alternate CPI measure. Unlike the theoretical approximation of geometric weighting
to a variable, substitution-prone market basket, the C-CPI-U is a direct measure of the
substitution effect. The difference in reporting is that August 2006 year-to-year inflation rates for the CPI-U
and the C-CPI-U were 3.8% and 3.4%, respectively. Hence current inflation still has a 0.4%
notch to be taken out of it through methodological manipulation. The C-CPI-U would not
have been introduced unless there were plans to replace the current series, eventually.
Traditional inflation rates
can be estimated by adding 7.0% to the CPI-U annual growth rate (3.8% +7.0% = 10.8% as
of August 2006) or by adding 7.4% to the C-CPI-U rate (3.4% + 7.4% = 10.8% as of August
2006). Graphs of alternate CPI measures can be found as follows. The CPI
adjusted solely for the impact of the shift to geometric weighting is shown in the graph on the home page of www.shadowstats.com.
The CPI adjusted for both the geometric weighting and earlier methodological changes is
shown on the Alternate Data page, which is available as a tab at the top of the home page.
Hedonic Thrills of Using
Federally Mandated Gasoline Additives
Aside from the changed weighting, the average person also tends to sense higher
inflation than is reported by the BLS, because of hedonics, as in hedonism. Hedonics adjusts
the prices of goods for the increased pleasure the consumer derives from them. That new washing machine you bought did not
cost you 20% more than it would have cost you last year, because you got an offsetting 20% increase in the pleasure you derive
from pushing its new electronic control buttons instead of turning that old noisy dial, according to the BLS.
When gasoline rises 10 cents per gallon because of a federally mandated gasoline additive, the increased gasoline
cost does not contribute to inflation. Instead, the 10 cents is eliminated from the CPI
because of the offsetting hedonic thrills the consumer gets from breathing cleaner air. The same principle applies to federally
mandated safety features in automobiles. I have not attempted to quantify the effects of questionable quality adjustments
to the CPI, but they are substantial.
Then there is "intervention analysis" in
the seasonal adjustment process, when a commodity, like gasoline, goes through violent price swings. Intervention analysis
is done to tone down the volatility. As a result, somehow, rising gasoline prices never seem to get fully reflected in the
CPI, but the declining prices sure do.
How Can So Many Financial Pundits Live Without
Consuming Food and Energy?
The Pollyannas on Wall Street like to play games with the CPI,
too. The concept of looking at the "core" rate of inflation-net of food and energy-was developed as a way of removing short-term
(as in a month or two) volatility from inflation when energy and/or food prices turned volatile. Since food and energy account
for about 23% of consumer spending (as weighted in the CPI), however, related inflation
cannot be ignored for long. Nonetheless, it is common to hear financial pundits cite annual "core" inflation as a way of showing
how contained inflation is. Such comments are moronic and such commentators are due the appropriate respect.
Too-Low
Inflation Reporting Yields Too-High GDP Growth
As is discussed in the final installment
on GDP, part of the problem with GDP reporting is the
way inflation is handled. Although the CPI is not used in the GDP
calculation, there are relationships with the price deflators used in converting GDP data
and growth to inflation-adjusted numbers. The more inflation is understated, the higher the inflation-adjusted rate of GDP
growth that gets reported.
| 1986-08 blue is dolla's buy power overseas |
|
Teddy Roosevelt's advice that, "We must drive the special interests out of politics. The citizens
of the United States must effectively control the mighty commercial forces which they have themselves called into being. There
can be no effective control of corporations while their political activity remains."
Don’t miss the collection of Pod Cast links
Nothing
I have seen is better at explaining in a balanced way the development of the national-banking system (Federal Reserve, Bank
of England and others). Its quality research and pictures used to support its
concise explanation set a standard for documentaries--at http://www.freedocumentaries.org/film.php?id=214. The 2nd greatest item in the U.S. budget
is payment on the debt.
|