U.S. Monetary Supply
The Concise Encyclopedia of Economics
Money Supply by Anna J. Schwartz, Economist at the
National Bureau of Economic Research, New York.
http://www.econlib.org/library/Enc/MoneySupply.html
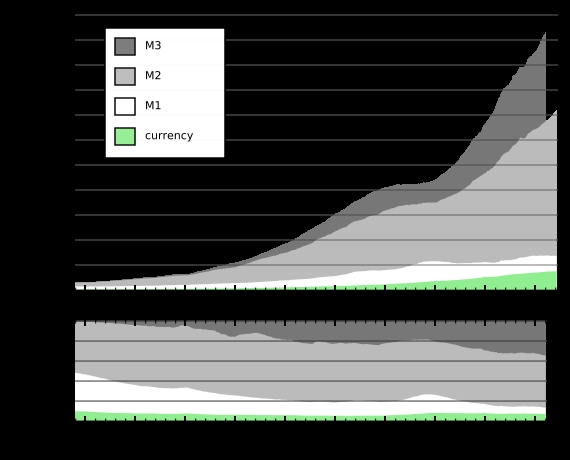
What Is the Money Supply?
The U.S. money supply comprises currency—dollar bills
and coins issued by the Federal Reserve System and the U.S. Treasury—and
various kinds of deposits held by the public at commercial banks and other depository institutions such as thrifts and credit
unions. On June 30, 2004, the money supply, measured as the sum of currency
and checking account deposits, totaled $1,333 billion. Including some types of savings deposits, the money supply totaled
$6,275 billion. An even broader measure totaled $9,275 billion.
These measures correspond to three definitions of money that
the Federal Reserve uses: M1, a narrow measure of money’s function as a
medium of exchange; M2, a broader measure that also reflects money’s function
as a store of value; and M3, a still broader measure that covers items that many
regard as close substitutes for money.
The definition of money has varied. For centuries, physical
commodities, most commonly silver or gold, served as money. Later, when paper money and checkable deposits were introduced,
they were convertible into commodity money. The abandonment of convertibility of money into a commodity since August 15, 1971,
when President Richard M. Nixon discontinued converting U.S. dollars into gold at $35 per ounce, has made the monies of the
United States and other countries into fiat money—money that national monetary authorities have the power to issue without
legal constraints.
What Determines the Money Supply?
Federal Reserve policy is the most important determinant
of the money supply. The Federal Reserve affects the money supply by affecting its most important component, bank deposits.
Here is how it works. The Federal Reserve requires depository
institutions (commercial banks and other financial institutions) to hold as reserves a fraction (typically 10%) of specified
deposit liabilities. Depository institutions hold these reserves as cash in their vaults or Automatic Teller Machines (ATMs)
and as deposits at Federal Reserve banks. In turn, the Federal Reserve controls reserves by lending money to depository institutions
and changing the Federal Reserve discount rate on these loans and by open-market operations. The Federal Reserve uses open-market
operations to either increase or decrease reserves. To increase reserves, the Federal Reserve buys U.S. Treasury securities
by writing a check drawn on itself. The seller of the treasury security deposits the check in a bank, increasing the seller’s
deposit. The bank, in turn, deposits the Federal Reserve check at its district Federal Reserve bank, thus increasing its reserves.
The opposite sequence occurs when the Federal Reserve sells treasury securities: the purchaser’s deposits fall, and,
in turn, the bank’s reserves fall.
If the Federal Reserve increases reserves, a single bank
can make loans up to the amount of its excess reserves, creating an equal amount of deposits. The banking system, however,
can create a multiple expansion of deposits. As each bank lends and creates a deposit, it loses reserves to other banks, which
use them to increase their loans and thus create new deposits, until all excess reserves are used up.
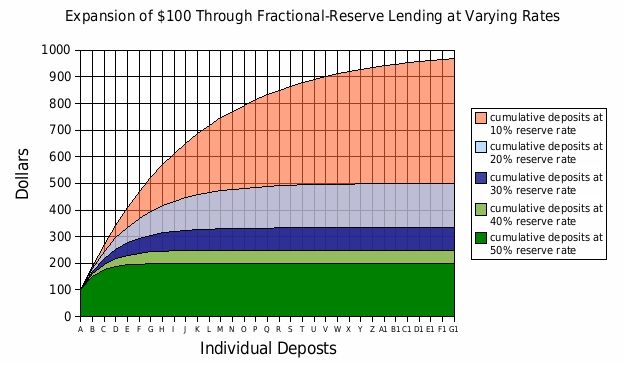
If the required reserve ratio is 10 percent, then starting
with new reserves of, say, $1,000, the most a bank can lend is $900, since it must keep $100 as reserves against the deposit
it simultaneously sets up. When the borrower writes a check against this amount in his bank A, the payee deposits it in his
bank B. Each new demand deposit that a bank receives creates an equal amount of new reserves. Bank B will now have additional
reserves of $900, of which it must keep $90 in reserves, so it can lend out only $810. The total of new loans the banking
system as a whole grants in this example will be ten times the initial amount of excess reserve, or $9,000: 900 + 810 + 729
+ 656.1 + 590.5, and so on. {Thus the Federal Reserve is printing money which is fed into our banking system and dispersal
through loans—consumer and commercial.[i]}
In a system with fractional reserve requirements, an increase
in bank reserves can support a multiple expansion of deposits, and a decrease can result in a multiple contraction of deposits.
The value of the multiplier depends on the required reserve ratio on deposits. A high required-reserve ratio lowers the value
of the multiplier. A low required-reserve ratio raises the value of the multiplier.
In 2004, banks with a total of $7 million in checkable deposits
were exempt from reserve requirements. Those with more than $7 million but less than $47.6 million in checkable deposits were
required to keep 3 percent of such accounts as reserves, while those with checkable accounts amounting to $47.6 million or
more were required to keep 10 percent. No reserves were required to be held against time deposits.
Even if there were no legal reserve requirements for banks,
they would still maintain required clearing balances as reserves with the Federal Reserve, whose ability to control the volume
of deposits would not be impaired. Banks would continue to keep reserves to enable them to clear debits arising from transactions
with other banks, to obtain currency to meet depositors’ demands, and to avoid a deficit as a result of imbalances in
clearings.
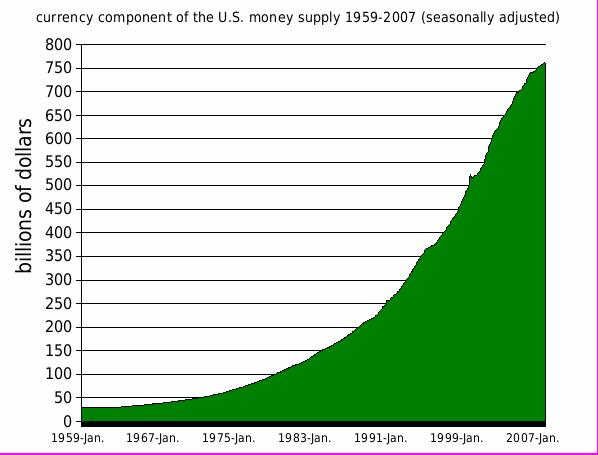
The currency component of the money supply, using the M2
definition of money, is far smaller than the deposit component. Currency includes both Federal Reserve notes and coins. The
Board of Governors places an order with the U.S. Bureau of Engraving and Printing for Federal Reserve notes for all the Reserve
Banks and then allocates the notes to each district Reserve Bank. Currently, the notes are no longer marked with the individual
district seal. The Federal Reserve Banks typically hold the notes in their vaults until sold at face value to commercial banks,
which pay private carriers to pick up the cash from their district Reserve Bank.
The Reserve Banks debit the commercial banks’ reserve
accounts as payment for the notes their customers demand. When the demand for notes falls, the Reserve Banks accept a return
flow of the notes from the commercial banks and credit their reserves.
The U.S.
mints design and manufacture U.S. coins for distribution to
Federal Reserve Banks. The Board of Governors places orders with the appropriate mints. The system buys coin at its face value
by crediting the U.S. Treasury’s account at the Reserve Banks. The Federal Reserve System holds its coins in 190 coin
terminals, which armored carrier companies own and operate. Commercial banks buy coins at face value from the Reserve Banks,
which receive payment by debiting the commercial banks’ reserve accounts. The commercial banks pay the full costs of
shipping the coin.
In a fractional reserve banking system, drains of currency
from banks reduce their reserves, and unless the Federal Reserve provides adequate additional amounts of currency and reserves,
a multiple contraction of deposits results, reducing the quantity of money. Currency and bank reserves added together equal
the monetary base, sometimes known as high-powered money. The Federal Reserve has the power to control the issue of both components.
By adjusting the levels of banks’ reserve balances, over several quarters it can achieve a desired rate of growth of
deposits and of the money supply. When the public and the banks change the ratio of their currency and reserves.
The
U.S. mints design and manufacture U.S.
coins for distribution to Federal Reserve Banks. The Board of Governors places orders with the appropriate mints. The system
buys coin at its face value by crediting the U.S. Treasury’s account at the Reserve Banks. The Federal Reserve System
holds its coins in 190 coin terminals, which armored carrier companies own and operate. Commercial banks buy coins at face
value from the Reserve Banks, which receive payment by debiting the commercial banks’ reserve accounts. The commercial
banks pay the full costs of shipping the coin.
In
a fractional reserve banking system, drains of currency from banks reduce their reserves, and unless the Federal Reserve provides
adequate additional amounts of currency and reserves, a multiple contraction of deposits results, reducing the quantity of
money. Currency and bank reserves added together equal the monetary base, sometimes known as high-powered money. The Federal
Reserve has the power to control the issue of both components. By adjusting the levels of banks’ reserve balances, over
several quarters it can achieve a desired rate of growth of deposits and of the money supply. When the public and the banks
change the ratio of their currency and reserves to deposits, the Federal Reserve can offset the effect on the money supply
by changing reserves and/or currency.
If
the Federal Reserve determines the magnitude of the money supply, what makes the nominal value of money in existence equal
to the amount people want to hold? A change in interest rates is one way to make that correspondence happen. A fall in interest
rates increases the amount of money people wish to hold, while a rise in interest rates decreases that amount. A change in
prices is another way to make the money supply equal the amount demanded. When people hold more nominal dollars than they
want, they spend them faster, causing prices to rise. These rising prices reduce the purchasing power of money until the amount
people want equals the amount available. Conversely, when people hold less money than they want, they spend more slowly, causing
prices to fall. As a result, the real value of money in existence just equals the amount people are willing to hold.
Changing
Federal Reserve Techniques
The
Federal Reserve’s techniques for achieving its desired level of reserves—both borrowed reserves that banks obtain
at the discount window and non-borrowed reserves that it provides by open-market purchases—have changed significantly
over time. At first, the Federal Reserve controlled the volume of reserves and of borrowing by member banks mainly by changing
the discount rate. It did so on the theory that borrowed reserves made member banks reluctant to extend loans because their
desire to repay their own indebtedness to the Federal Reserve as soon as possible was supposed to inhibit their willingness
to accommodate borrowers. In the 1920s, when the Federal Reserve discovered that open-market operations also created reserves,
changing nonborrowed reserves offered a more effective way to offset undesired changes in borrowing by member banks. In the
1950s, the Federal Reserve sought to control what are called free reserves, or excess reserves minus member bank borrowing.
The
Fed has interpreted a rise in interest rates as tighter monetary policy
and a fall as easier monetary policy. But interest rates are an imperfect indicator of monetary policy. If easy monetary policy
is expected to cause inflation, lenders demand a higher interest rate to compensate for this inflation, and borrowers are
willing to pay a higher rate because inflation reduces the value of the dollars they repay. Thus, an increase in expected
inflation increases interest rates. Between 1977 and 1979, for example, U.S.
monetary policy was easy and interest rates rose. Similarly, if tight monetary policy is expected to reduce inflation, interest
rates could fall.
From
1979 to 1982, when Paul Volcker was chairman of the Federal Reserve, the Fed tried to control non-borrowed reserves to achieve
its monetary target. The procedure produced large swings in both money growth and interest rates. Forcing non-borrowed reserves
to decline when above target led borrowed reserves to rise because the Federal Reserve allowed banks access to the discount
window when they sought this alternative source of reserves. Since then, the Federal Reserve has specified a narrow range
for the federal funds rate, the interest rate on overnight loans from one bank to another, as the instrument to achieve its
objectives. Although the Fed does not directly transact in the Fed funds market, when the Federal Reserve specifies a higher
Fed funds rate, it makes this higher rate stick by reducing the reserves it provides the entire financial system. When it
specifies a lower Fed funds rate, it makes this stick by providing increased reserves. The Fed funds market rate deviates
minimally from the target rate. If the deviation is greater, that is a signal to the Fed that the reserves it has provided
are not consistent with the funds rate it has announced. It will increase or reduce the reserves depending on the deviation.
The
big change in Federal Reserve objectives under Alan Greenspan’s chairmanship was the acknowledgment that its key responsibility
is to control inflation. The Federal Reserve adopted an implicit target for projected future inflation. Its success in meeting
its target has gained it credibility. The target has become the public’s expected inflation rate.[ii]
History of the U.S. Money Supply
From
the founding of the Federal Reserve in 1913 until the end of World War II, the money supply tended to grow at a higher rate
than the growth of nominal GNP. This increase in the ratio of money supply to GNP shows an increase in the amount of money
as a fraction of their income that people wanted to hold. From 1946 to 1980, nominal GNP tended to grow at a higher rate than
the growth of the money supply, an indication that the public reduced its money balances relative to income. Until 1986, money
balances grew relative to income; since then they have declined relative to income. Economists explain these movements by
changes in price expectations, as well as by changes in interest rates that make money holding more or less expensive. If
prices are expected to fall, the inducement to hold money balances rises since money will buy more if the expectations are
realized; similarly, if interest rates fall, the cost of holding money balances rather than spending or investing them declines.
If prices are expected to rise or interest rates rise, holding money rather than spending or investing it becomes more costly.
Since
1914 a sustained decline of the money supply has occurred during only three business cycle contractions, each of which was
severe as judged by the decline in output and rise in unemployment: 1920–1921,
1929–1933, and 1937–1938. The severity of the economic decline in each of these cyclical downturns, it is widely
accepted, was a consequence of the reduction in the quantity of money, particularly so for the downturn that began in 1929, when the quantity of money fell by an unprecedented one-third.
There have been no sustained declines in the quantity of money in the past six decades.
The
United States has experienced three major price inflations since 1914, and each has been
preceded and accompanied by a corresponding increase in the rate of growth of the money supply: 1914–1920, 1939–1948,
and 1967–1980. An acceleration of money growth in excess of real output growth has invariably produced inflation—in
these episodes and in many earlier examples in the United States and elsewhere
in the world.
Until
the Federal Reserve adopted an implicit inflation target in the 1990s, the money supply tended to rise more rapidly during
business cycle expansions than during business cycle contractions. The rate of rise tended to fall before the peak in business
and to increase before the trough. Prices rose during expansions and fell during contractions. This pattern is currently not
observed. Growth rates of money aggregates tend to be moderate and stable, although the Federal Reserve, like most central
banks, now ignores money aggregates in its framework and practice. A possibly unintended result of its success in controlling
inflation is that money aggregates have no predictive power with respect to prices.
The
lesson that the history of money supply teaches is that to ignore the magnitude of money supply changes is to court monetary
disorder. Time will tell whether the current monetary nirvana is enduring and a challenge to that lesson.
[ii] The problem is that through funny bookkeeping much that is inflation isn’t counted. For example, changes in the cost of food, energy, and most manufactured goods, among
other things are not used in determining the rate of inflation. The result of
this is benefits tied to the rate of inflation are reduced, including salaries, social security payments, and return on bank
deposits.